
UNIVERSITI KEBANGSAAN MALAYSIA

LABORATORY REPORT
DEVELOPMENT OF PHARMACEUTICAL PRODUCT I
(NFNF 2213)
TITLE : CHARACTERISATION OF EMULSION FORMULATIONS
GROUP : 2
NAME : MUHAMMAD RASYDAN BIN BUCHEK A168185
FARINA ZAHIDAH BINTI ABD AZIZ A168417
NUR AQILAH BINTI ABDUL KADIR A169046
LILLIAN YEO FANG FANG A167802
LECTURER’S NAME : PROF. MADYA DR. NG SHIOW FERN
SEMESTER I, SESSION 2019-2020
FACULTY OF PHARMACY
TITLE
Characterisation of emulsion formulations
DATE
7th October 2019
OBJECTIVE
To determine:
1. The effects of HLB of surfactant on the stability of the emulsion.
2. The effects of different oil phases used in the formulation on the physical characteristics and stability of the emulsion.
INTRODUCTION
An emulsion is a mixture of two or more liquids that are normally immiscible where one liquid contains a dispersion of the other liquids. Emulsion has two phases where one of them is internal or dispersed phase, which dispersed homogeneously in another liquid called external or continuous phase. In other words, an emulsion is a special type of mixture made by combining two liquids that normally don’t mix. Emulsions are part of a more general class of two-phase systems of matter called colloids. Emulsions usually appear cloudy or white because light is scattered off the phase interphases between the components in the mixture.
There are two types of emulsion, known as oil in water (o/w) and water in oil (w/o) emulsions. The type of emulsion depends on the properties of the dispersed phase and continuous phase. If the oil phase is dispersed in a continuous aqueous phase, it is known as oil in water emulsion. If the aqueous phase is the dispersed phase and the oil phase is the continuous phase, it is known as water in oil emulsion. Meanwhile, the boundary between the phases is called the interface.
Most emulsions are unstable, with components that won’t mix on their own or remain suspended indefinitely. Therefore, emulsifiers need to be added into emulsion formulation. This is because emulsifiers have the unique ability to attract water (hydrophilic) and oil (lipophilic), forming a film over one phase in a mixture to form globules that repel each other. Thus, this allow the molecules to coat the dispersed phase and keep it uniformly suspended in the continuous phase. When added to an o/w emulsion, emulsifiers will surround the oil droplet with non-polar tails extending into the oil, and polar head groups facing the water. For w/o emulsion, non-polar tails extend outward into the oil phase, while polar head groups point into the water droplet. In this way, emulsifiers lower the interfacial tension between the oil and water phases, stabilizing the droplets and preventing them from coalescing. Different emulsifiers have different Hydrophilic–Lipophilic Balance, HLB values which enable to predict the ability to stabilize various kinds of emulsion. HLB is the balance of the size and strength of the hydrophilic and lipophilic moieties of a surfactant molecule. The HLB scale ranges from 0 to 20. Emulsifiers with HLB values greater than 10 are more hydrophilic and thus better at stabilizing o/w emulsions. In contrast, emulsifiers with HLB values less than 10 are more hydrophobic and therefore better suited for w/o emulsions.
| HLB value = |
(quantity surfactant 1)(HLB surfactant 1) + (quantity surfactant 2)(HLB surfactant 2) |
|
Quantity surfactant 1 + quantity surfactant 2 |
APPARATUS AND MATERIALS
Apparatus
8 Test tubes 1 set of 5ml pipette and bulb
A 50ml measuring cylinder 1 50ml beaker
2 sets of pasture pipettes and droppers 1 15ml centrifugation tube
Vortex mixer Centrifugation apparatus
Weighing boat Viscometer
1 set of mortar and pestle Water bath (45°C)
Light microscope Refrigerator (4°C)
Microscope slides
Materials
Palm oil Span 20
Arachis oil Tween 80
Olive oil Sudan III solution (0.5%)
Mineral oil
Distilled water
PROCEDURE
1. Each of the test tubes were labelled and 1cm line were marked on each test tube. 2. 4ml of oil and 4ml of distilled water were added into the test tubes.
| Group | Oil |
| 1,5,9 | Palm oil |
| 2,6,10 | Arachis oil |
| 3,7,11 | Olive oil |
| 4,8,12 | Mineral oil |
For our group we were using Arachis oil. 3. Span 20 and Tween 80 were added to the mixture of oil and water in each of the test tube. The mixture was closed and the content was mixed by using a vortex mixer for 45 seconds. The time for the interface to reach 1cm was recorded and HLB value of each mixture was calculated and determined. Step 1 to 3 were repeated to obtain the average value of HLB.
| Tube no. | 1 | 2 | 3 | 4 | 5 | 6 | 7 | 8 |
| Span 20 (drops) | 15 | 12 | 12 | 6 | 6 | 3 | 0 | 0 |
| Tween 80 (drops) | 3 | 6 | 9 | 9 | 15 | 18 | 15 | 0 |
4. A few drops of Sudan III solution was added to the most stable emulsions in weighing boat and homogeneously mixed. Some of the mixture was spread on the glass slide and observed under the light microscope under magnification x10. The appearance of the emulsion was captured by taking a picture of it.
5. The Mineral Oil Emulsion (50g) was prepared as the formulation given by using wet gum method.
| Emulsion | Group | Mineral Oil (ml) |
| I | 1,5,9 | 20 |
| II | 2,6,10 | 25 |
| III | 3,7,11 | 30 |
| IV | 4,8,12 | 35 |
For our group, we are using 25ml of Mineral oil.
| Mineral Oil | 25ml |
| Acacia | 6.25g |
| Syrup | 5ml |
| Vanillin | 2g |
| Alcohol | 3ml |
| Distilled water | to 50ml |
6. The emulsion was placed into the 50ml beaker and stirred by using magnetic stirrer on a plate stirrer for 2 minutes.
7. 2g of emulsion was placed into a weighing boat and labelled. A few drops of Sudan III solution was added and mixed. The texture, consistency, degree of oily appearance and colour spreading in the sample were compared under the light microscope with magnification x10.
8. The viscosity of the emulsion formed after homogenization was determined by adding 15ml of emulsion into 50ml beaker by using viscometer. The viscometer was calibrated with spindle LV-4 type. The emulsion was exposed into the water bath with a temperature 45 °C for 10-15 minutes then into the refrigerator which temperature 4 °C for another 10-15 minutes. Lastly in the room temperature for 10-15 minutes. The viscosity of emulsion was determined after the temperature cycle.
9. 5g of homogenized emulsion was added into the centrifugation tube and centrifuged with 4500 rpm for 10 minutes under 25 °C. The separation height was measured and the ratio of the height separation was determined.
RESULT
1. Time needed for the interface to reach 1cm.
|
Sample |
Palm Oil (Group 1) | Arachis Oil (Group 2) | Olive Oil (Group 3) | Mineral Oil (Group 4) |
|
Time needed (min) |
||||
| 1 | 136.5 | Does not form interface after 120 minutes | 64.45 | Interface does not reach 1 cm after 90 minutes |
| 2 | 62.5 | Does not form interface after 120 minutes | Does not form interface after 120 minutes | Interface does not reach 1 cm after 90 minutes |
| 3 | 112 | Interface does not reach 1 cm after 120 minutes | 93.27 | Interface does not reach 1 cm after 90 minutes |
| 4 | 50.5 | 50 | 19.92 | Interface does not reach 1 cm after 90 minutes |
| 5 | 19.5 | Interface does not reach 1 cm after 120 minutes | 24.78 | Interface does not reach 1 cm after 90 minutes |
| 6 | 63.5 | 93 | 16.73 | 10.0 |
| 7 | 60.5 | 19 | 25 | 7.0 |
| 8 | 3 | 25 | 3.7 | 0.22 |
Table 1
2. Average HLB Value for each sample.
| Sample | 1 | 2 | 3 | 4 | 5 | 6 | 7 | 8 |
| HLB Value | 9.67 | 10.73 | 11.34 | 12.44 | 13.17 | 14.09 | 15.00 | 0 |
Table 2
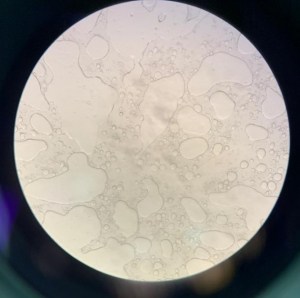
3. Appearance of emulsion under light microscope.
Size of globule: uniform and evenly distributes (except for palm oil).
|
Palm Oil (Group 1) |
Arachis Oil (Group 2) |
 |
 |
| Olive Oil (Group 3) |
Mineral Oil (Group 4) |
 |
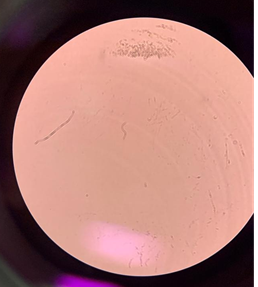 |
Table 3
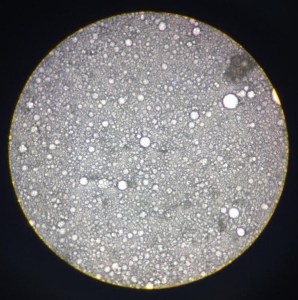
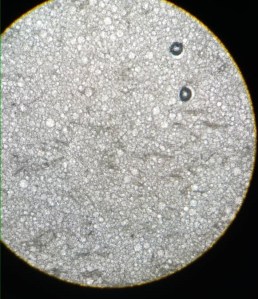
4. Appearance of emulsion.
| Mineral Oil (mL) | Picture of magnification (10x) | Texture | Consistency | Degree of oily appearance | Spreading of colour |
| 20 (Group 1) | 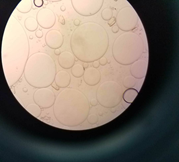 |
Smooth milky and homogenous mixture | Consistent and easy to pour | Large and small globules appear and a layer of oil floods on top of mixture | The red colour is evenly spread within the small and big droplets |
| 25 (Group 2) | 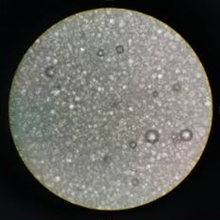 |
Less viscous and watery | Thick and easy to pour | Appears as oily | The red colour is slowly and evenly spread |
| 30 (Group 3) | 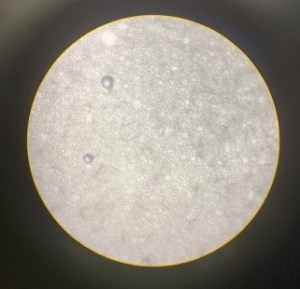 |
Homogeneous, smooth, shiny and milky | Very consistent | Little greasy | Shiny and evenly spread |
| 35 (Group 4) | 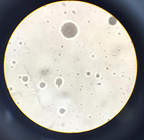 |
Look pale, very viscous | Flowy | Large and small globules appears | Uneven colour of spreading |
Table 4
5. Viscosity of the emulsion formed after homogenization.
| Viscosity (cP) | |||||||||
| Mineral Oil (mL) | Before Temperature Cycle | Average | After Temperature Cycle | Average | Difference (%) | ||||
|
20 (Group 1) |
186 | 204 | 228 | 206 | 162 | 144 | 144 | 150 | 37.33 |
|
25 (Group 2) |
18 | 18 | 18 | 18 | 35 | 37 | 42 | 38 | 52.63 |
|
30 (Group 3) |
23.9 | 25.1 | – | 24.5 | 59.0 | 56.4 | – | 57.7 | 57.54 |
|
35 (Group 4) |
684 | 678 | 680 | 680.67 | 900 | 930 | 970 | 933.33 | 27.07 |
Table 5
6. Ratio of separation phase.
| Mineral Oil (ml) | Ratio of separation phase | Average | ||
| 20 (Group 1) | 0.78 | 0.78 | 0.79 | 0.78 |
| 25 (Group 2) | 0.62 | 0.65 | 0.62 | 0.63 |
| 30 (Group 3) | 0.54 | 0.57 | 0.56 | 0.56 |
| 35 (Group 4) | 0.40 | 0.39 | 0.41 | 0.40 |
Table 6
DISCUSSION
An emulsion is a colloid of two or more immiscible liquids where one liquid contains a dispersion of the other liquids. In other words, an emulsion is a special type of mixture made by combining two liquids that normally do not mix. The excipient is added to the emulsion to stabilize the emulsion that prepared. In this experiment, HLB value of each test tube that have different number of drops of Span 20 and Tween 80 is calculated. There are also four different types of oil which is palm oil, Arachis oil, olive oil and mineral oil.
HLB stands for Hydrophilic-Lipophilic Balance. The HLB method is used to determine the quantity and type of surfactant that is needed to prepare a stable emulsion. The experiment that we have done has clearly shown the effects of HLB surfactant on the stability of the emulsion. Emulsifier with low HLB value (below 9.0) is lipophilic in character while the one that is hydrophilic in nature possesses a high HLB value (above 11.0). Those with an HLB value in between 9-11 are intermediate.
The first experiment conducted is to observe the average time taken for the interface between two phases in emulsion with various HLB to reach 1 cm. Generally, the emulsion contains 50% (4 ml) water and 50% (4 ml) oil with various ratio of combination of surfactants to produce emulsion with various HLB. The Span emulsifiers are usually lipophilic and the Tween products are usually hydrophilic. In this experiment, eight simple emulsions were prepared in eight test tubes with each have the same amount of oil and distilled water. The test is conducted with different types of oil which includes Palm Oil, Arachis Oil, Olive Oil, and Mineral Oil. Different amounts of Tween and Span were added to the test tubes. Theoretically, the HLB value required Palm oil is 8, Arachis oil 6, Olive oil is 7 and mineral oil emulsion is 10. The HLB value required means as the most optimum or ideal HLB value of surfactant /combination of surfactant that can maximise the stability of the emulsion in given system of using particular oil.
During the experiment, our group (Group 2) conducted this experiment using Arachis oil. From the result obtained, the test tube 1 and 2 produced among the most stable emulsion as it takes longest time for phase separation to reach 1 cm which is do not form interface after 90 minutes while test tube 3, 4, 5, 6, 7, and 8 is the less stable as it takes a shorter duration of time for phase separation to reach 1 cm. Even if the HLB value of test tube 1, 2, and 3 which are 9.67, 10.73, and 11.34 respectively is further from HLB value required of Arachis oil which is 6, the result still can be accepted as the nature of surfactant is said can also be influenced by temperature and other factors.
Other than that, in Table 1, it is shown that the result for Palm oil from Group 1. As we can see from the table, test tube 1 has the longest time taken for the interface to reach 1 cm which indicates that it is the most stable emulsion. It is because the separation of phase need the longest time to occur. These show that the ratio of surfactants used are the most closest to the ideal ratio of surfactant needed to stabilize palm oil emulsion. Next, test tube 3 shows intermediate stability which the phase separation take shorter time than test tube 1 but longer time that the others (test tube 2, 4, 5, 6, 7and 8). It is shows that test tube 2,4,5,6,7 and 8 did not suitable ratio to stabilize the emulsion.
For olive oil, we can observe from the Table 1 that the test tube 2 and 3 produced among the most stable emulsion as it takes longest time for phase separation to reach 1 cm while test tube 1 have intermediate emulsion stability. Test tube 4, 5, 6, 7, and 8 is the less stable as it takes a shorter duration of time for phase separation to reach 1 cm. These shows that the ratio of surfactants in test tube 2 and 3 is suitable to produce stable olive oil-based emulsion. The HLB required for olive oil is 7.
Furthermore, based on the Mineral oil emulsion result shows that test tube 1,2,3,4,5 have the longest time time taken for the interphase to reach 1 cm while test tube 6,7 and 8 have the shortest time taken . It is indicates that test tube 1,2,3,4 and 5 have the most stable surfactant ratios to stabilize the emulsion. The best ratio of the surfactant must have HLB value that closest to the HLB value required for Mineral oil emulsion.
Sudan III is a fat soluble dye which stains the oil molecule red. Sudan III test can be used to determine the type of emulsion, shape and size of the globules in the emulsion. If a red background is observed in the emulsion, it is a w/o emulsion as oil is the continuous phase whereas if red globules are present in a clear background, it is an o/w emulsion. In test tube 1 of Arachis oil, the size of globules formed are relatively uniform and evenly distributed. A few medium and large globules are seen. Sudan III solution or red colour solution is slowly and evenly spread in test tube 1. This is due to the difficulty of the Sudan III molecule to penetrate the surfactant barrier around the oil molecule. Therefore, we can conclude that emulsion 1 is the most stable due to the appropriate amount of emulsifier.
The next experiment is preparing mineral oil emulsion using wet gum method to produce oil in water (o/w) type of emulsion. The emulsion was produced with different amounts of mineral oil which is 20ml, 25ml, 30ml and 35 ml. Several excipients were incorporated into the emulsion to ensure good stability of the emulsion such as acacia, vanillin, alcohol and syrup. Acacia acts as a surface active agent to ensure the dispersed phase can be dispersed and incorporate evenly in the continuous phase. Acacia also increase the kinetic stability of an emulsion so that the size of the droplets does not change significantly with time and lower the possibilities of emulsion to undergo creaming or breaking process. Syrup is used to increase the viscosity of the emulsion and responsible as a sweetening agent. Vanillin is used as a flavouring agent besides increase patient’ acceptability. Alcohol is used as an antimicrobial agent to prolong the storage time of the emulsion by preventing the growth of microorganisms.
The purpose of homogenization is to homogenize two immiscible liquid into a smooth emulsion by making the droplets into extremely small particles dispersed evenly in the continuous phase. In this experiment, homogenization plays it role by further breaking the droplets into extremely small droplets. The unstable emulsion will only become stable after the homogenization because vibration force applied to the big globules can break them into smaller globules which is more stable. Sudan III solution is added to the emulsion to act as a dye which color the oil phase to give a better view under the microscope. From the results obtained, in general, the texture of all the four emulsions will become smooth and more consistent, less oily and the more viscous after homogenization.
After homogenization, the viscosity of each emulsion is determined. Based on the result for 25 ml of mineral oil shows that the average viscosity before temperature cycle is 18cP while after temperature cycle is 38cP. The difference percentages of viscosity of 25 ml mineral oil is 52.63%. Theoretically, emulsion that have higher amount of oil as dispersed phase will have higher viscosity as oil is more viscous than water. The temperature cycle will also affect the viscosity of the emulsion as it disrupts the adsorbed layer of emulsifying agent at the oil/water interphase. However, the result has shown that some of the viscosities of emulsions produced are not proportional to the amount of oil incorporated as this is observed from the trend for both before and after temperature cycle result. From the result, it can be seen that the result varies significantly between groups which may be due to some errors done when taking viscometer reading or during the experiment. A good and stable emulsion should have a low difference in percentage between before and after the temperature cycle.
Moreover, centrifugation is a separating process to separate aqueous phase and the oily phase. To produce a stable and homogenous emulsion, the phase separation ratio must always be kept at a minimum level, so that the drug can be dispersed uniformly in the emulsion and the administration of accurate dose can be achieved. The higher the viscosity, the lesser the phase separation of emulsion, thus the more stable emulsion. From the experiment, the ratio of separation phase of 20 ml mineral oil shows the highest ratio of separation which is 0.78 because of less viscous. For average ratio of separation emulsion that have mineral oil of 25 ml is 0.62, 25ml is 0.56 and 35 ml is 0.4. From the result of separation phase ratio, it can be concluded that viscosity correlates with the separation phase ratio. Therefore, the viscosity must be kept at a good level to obtain a low separation phase ratio.
Lastly, several precautions should be taken in this experiment to reduce errors and improve accuracy in the results. Firstly, the emulsion should be mixed homogeneously by using a mortar and pestle. Secondly, eyes must be perpendicular to measuring cylinder’s reading to prevent any parallax error. The rotor at the viscometer should be rinsed before being dipped into another emulsion to prevent any error in viscosity reading. Besides, the emulsion should be stirred well before testing its viscosity.
CONCLUSION
The HLB value required on maintaining a stable can be determined by the type of oil used. For arachis oil, the HLB value required is 6 and the most stable emulsion for this emulsion is Test tube 1 which has the nearest number to 6 which is 9.67.
The amount of oil in formulation determined the physical characteristics and stability of the emulsion. If more oil is added into the formulation, the appearance will look oily as the oil becomes the continuous phase. Vice versa, if oil is in small amounts, it becomes the dispersed phase and the appearance become watery.
The viscosity of the mixtures increase with the amount of oil added. Oil is more viscous than water. The large viscosity maintains the stability of the emulsion after the centrifugation providing 35 mL of mineral oil in the emulsion is the most stable emulsion with 27.07%, the smallest difference within temperature cycle the smallest ratio of separation which is 0.4 after the centrifugation.
REFERENCES
2. https://en.m.wikipedia.org/wiki/Emulsion
3. https://www.sciencedirect.com/topics/agricultural-and-biological-sciences/centrifugation


